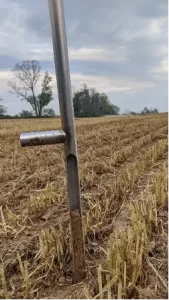
Soil testing provides a “snap-shot” in time. It will offer nutrient levels for the day the soil test is taken. Many variables affect the soil test results, including the crop grown, manure and fertilizer applications, time of year, depth of the sample, etc. Rosetree Consulting’s fertility recommendations consider all these variables to provide the correct manure or fertilizer application rate. Soil testing through time will result in trends in nutrient levels that can be graphed to show increases or decreases in nutrient levels. This trend line is critical in dealing with nutrient management regulations and discerning if fertilizer recommendations require adjustments. Continue reading our guide to Understanding Your Soil Test.
The first step for developing a successful fertility plan is understanding what the soil test results tell you – the optimal levels and where your immediate needs reside. The following is a summary we use to help clients understand their soil test results.
Soil pH: A measurement of aluminum & hydrogen’s activity in the soil. When a soil is saturated with aluminum & hydrogen, it behaves like a weak acid. As pH declines below 6.0, and especially when pH is less than 5.5, free aluminum molecules are present in the soil, acting like rootworms – they “eat” away the roots. pH is expressed in a logarithmic scale: pH 7 is neutral, pH 6 is ten times lower than pH 7, and pH 5 is 100 times lower than pH 7. The target pH is as follows:
Grass hay – 6.0 Corn, wheat, soybeans – 6.5 Alfalfa – 7.0
Typically, there is a strong correlation between pH & available calcium (%Ca on the Cation Exchange Capacity). At optimal and higher soil pH, phosphorus binds to Iron and Aluminum. As pH declines, phosphorus releases Iron and aluminum and binds to Calcium, making the Calcium unavailable (unavailable nutrients do not appear in the soil test). Please remember that Calcium does NOT correct soil pH – carbonates do. As lime (CaCO3 — calcium carbonate) is applied, the carbonate (CO3) and Calcium slowly separate over a 3 to 6-month period. Carbonate binds with hydrogen to form carbon dioxide & water, and Calcium binds to clay & organic matter. As the pH increases from the carbonate reaction, phosphorus will release Calcium & bind with aluminum.
The following chart is an easy way to determine how many times more acid a lower pH value is than a higher one:
| pH difference | Times more acid | pH difference | Times more acid | pH difference | Times more acid |
|---|---|---|---|---|---|
| 0.1 | 1.3 | 1.1 | 13 | 2.1 | 126 |
| 0.2 | 1.6 | 1.2 | 16 | 2.2 | 158 |
| 0.3 | 2.0 | 1.3 | 20 | 2.3 | 200 |
| 0.4 | 2.5 | 1.4 | 25 | 2.4 | 251 |
| 0.5 | 3.2 | 1.5 | 32 | 2.5 | 316 |
| 0.6 | 4.0 | 1.6 | 40 | 2.6 | 398 |
| 0.7 | 5.0 | 1.7 | 50 | 2.7 | 501 |
| 0.8 | 6.3 | 1.8 | 63 | 2.8 | 631 |
| 0.9 | 7.9 | 1.9 | 79 | 2.9 | 794 |
| 1.0 | 10.0 | 2.0 | 100 | 3.0 | 1000 |
Buffer pH: A tool we use to develop our limestone recommendations. At the sampling lab, they add a known amount of liming material to the sample and retest the pH. The difference between the 1st and 2nd testing and the CEC reading allows us to accurately determine the amount of lime required to raise the soil pH to our target pH.
OM – Organic Matter: Organic matter will range from 2% to 3% in most soils in our geography. Organic matter is essential in nutrient availability (primarily nitrogen and sulfur), water-holding capacity, soil structure, and soil stability. Soil organic matter will hold ten times the amount of available nutrients than a comparable volume of mineral soil. Long-term goals should be to increase soil organic matter through cover crops, reduce tillage/no-till & raise high-yielding crops. It is a very slow process to raise OM in your soil.

Roughly 50% of organic matter is carbon, 5% nitrogen, 0.5% sulfur & 0.5% phosphorus. Some soil tests will show the nitrogen available to a crop from organic matter mineralization. It is known as “Estimated Nitrogen Release.”
Estimated Nitrogen Release — A common question within the organic matter discussion is “How much nitrogen is in the soil?” Accurate estimates of soil nitrogen are highly suspect, as soil nitrogen availability depends on soil moisture, soil texture, microbial activity, and soil temperature. Organic matter is mineralized or broken down by soil microbes. These critters need adequate soil moisture and warm soil temperatures to maximize mineralization, so most of the soil nitrogen released from organic matter occurs between May and September. An approximation of the estimated nitrogen release is 25 lbs of nitrogen per 1% of organic matter.
Phosphorus and Potassium: Soil phosphorus (P) and soil potassium (K), reported in parts per million, is an estimate of the available phosphorus and potassium. Soil test results will show around 10% of the total phosphorus in a field. Most phosphorus is bound in molecules that are too big & complex for plant uptake – thus, they are not accounted for in the soil test results. The optimal level for soil test phosphorus is around 50-100 ppm. For soil test potassium, optimal levels are 120 to 200 ppm for row crops and 200 to 300 ppm for forages. There is no 1:1 relationship between added phosphorus or potassium and an increase in the soil test. It will take between 12 and 24 lbs of added phosphorus to raise the soil test level to 2 ppm between 8 and 16 lbs of added potassium.
For nutrient management plans, soil phosphorus is a big concern. Elevated phosphorus levels in surface water have been shown to cause an imbalance in the natural ecosystem of the Chesapeake Bay and other watersheds. Phosphorus has a very high affinity for bonding to soil particles, so most phosphorus (more than 95%) entering rivers & streams is lost through soil erosion. Rainwater that does not infiltrate the soil enters streams, carrying soil sediment (with attached phosphorus particles) and, to a much lesser extent, dissolved phosphorus. We see an interesting trend in continuous no-till fields where all phosphorus is surface applied. Sediment P is significantly reduced, but dissolved P is increasing.
Phosphorus does not leach easily, less than 1/4 inch/yr (Compared to nitrogen, which can leach several feet within a month). Of all the phosphorus in the soil, only about 0.25-0.5% is dissolved in water and “plant available.” Reducing soil erosion (no-till, cover crops, grassed & stone waterways) and installing stream buffers can significantly reduce phosphorus entry into surface waters.
For the long-term sustainability of a field to receive manure within current regulations, manage manure and fertilizer applications to maintain soil P below 200 ppm.
“Can I increase phosphorus uptake in my crop?” Several products on the market can increase the availability of phosphorus in the soil by suppressing its ability to bond with other molecules. For this conversation, let’s assume these products work. The other side of this question is – can I increase plant uptake? The answer is “marginally, but probably not in a significant way.” Plants have a complex process for regulating nutrient uptake. If allowed to enter the plant without regulation, many of the nutrients would kill the plant. There is an upper limit on the amount of phosphorus the plant can take in without causing injury to itself. No matter how much we increase the soil’s available phosphorus, it isn’t easy to coax the plant to take in more phosphorus than it needs.

CEC – Cation Exchange Capacity: A measurement of a soil’s ability to hold positively charged elements like potassium, Calcium, magnesium, sodium, and hydrogen. Think of it as the soil’s nutrient reservoir. The larger the reservoir, the more nutrient-supplying capacity your soil has: the soil’s clay and organic matter content influence CEC. If a CEC is less than 7.0, we have concerns about the soil’s ability to hold nitrogen for the entire growing season and recommend split-applying nitrogen. Increasing the organic matter through time should improve CEC.
CEC is not a direct measurement of a soil’s nutrient-holding capacity. Instead, it is an estimate based on soil test extractable Ca, K, and Mg and some rapid measure of exchangeable acidity. It is calculated using the following calculation, which works best when soil pH is less than 7.2.
CEC = (ppm Ca / 200) + (ppm Mg / 120) + (ppm K / 390)
There are testing labs that can perform the CEC measurement. While it is expensive to perform, it can be done upon request.
% Saturation: The percentage of the CEC that is potassium (K), magnesium (Mg), and Calcium (Ca). There are no ideal ratios for K/Mg/Ca. In the 1940s, some compelling work on alfalfa grown on sandy soil in New Jersey identified optimal % saturations. This work could have translated better to other soils in different locations, but it is still frequently referenced today. The total % saturation (Ca + Mg + K), in most soils, equals a number less than 100 because other cations in the soil are not tested. If the soil is flooded with “free” Calcium or Magnesium, the % Saturation can exceed 100. This can happen in fields with a long history of layer manure applications. Our experience, which should be considered anecdotal evidence, suggests that Potassium levels should be 3-4%, Magnesium levels should be 12-15%, and calcium levels over 65%. Most plant samples we take during the growing season show optimal K, Mg & Ca uptake when soil tests are within this range.
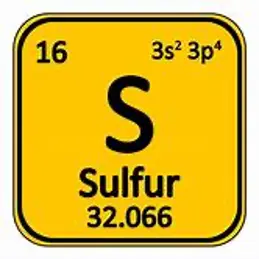
Sulfur: Sulfur levels should range from 20-40 ppm on the soil test report. Deficiencies have increased over the last 10-15 years due to reduced air pollution and inadequate sulfur fertilization. Plants uptake sulfur in the form of Sulfate (SO4-2). Any elemental Sulfur present in fertilizer or the soil must be converted before SO4-2plant uptake—fertilizer products like Ammonium Sulfate, Potassium Sulfate, and KMag use Sulfate as the sole sulfur source. Potassium Thiosulfate, a common liquid Sulfur source, combines elemental sulfur & SO4-2. The sulfate portion is immediately available for plant uptake, while the elemental S will take some time to convert.
The conversion of elemental sulfur to Sulfate, whether from a fertilizer source, manure source, or soil organic matter, will depend on soil temperature and microbial activity. Once elemental sulfur is “free” in the soil, microbes can convert it to SO4-2 within 7-14 days. Sulfate (SO4-2), much like nitrate (NO3-), leaches in the soil. It can also be converted to a gas and lost from the soil.
Sulfur fertility programs generally focus on offsetting crop removal, as the need has been confirmed through years of soil testing and plant analysis. Most crops require 20-30 lbs of sulfur to offset crop removal, possibly more if soil test/plant samples indicate additional need.
Micronutrients:
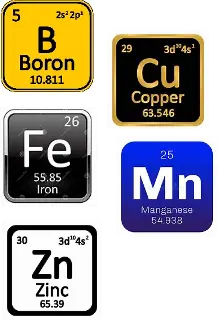
We’re not going to talk a lot about micronutrients in this article because the crop need for things like Zinc, Manganese, and Boron is comparatively small. The soil’s micronutrient levels are good to know, and soil testing can identify general trends in micros. Still, plant tissue testing is a more accurate tool to determine micronutrient needs for important stages of growth. Here’s a chart of optimal soil test levels for micronutrients.
| Micronutrient | Optimal Level |
|---|---|
| Boron | 1.7-2.6 ppm |
| Copper | 1.3-17.3 ppm |
| Iron | 65-182 ppm |
| Manganese | 12-167 ppm |
| Zinc | 4-11 ppm |
Developing a Fertility Program
Great – your soil test results are back! Once we receive soil test results from the lab, we send results to our clients with manure, limestone, phosphorus, and potash recommendations. We meet with each client over the winter months to discuss the results in detail and develop a farm-specific fertility plan. Our agronomists come to the winter meeting with the knowledge of soil fertility, 4R nutrient stewardship, nutrient management regulations, the history of working with that client, and ideas for increasing yield. The clients bring ideas, a list of what worked & didn’t work last year, and a rough fertility budget to this meeting to ensure our fertility plans fit within their financial parameters. A fertilizer budget is not a fixed number but a floating percentage based on expected revenue. Farms will and should adjust fertilizer budgets based on the price of corn or the cost of milk.
We use a 4R Nutrient Stewardship Strategy to develop a fertility plan. 4R strategies look at the Right Source, Right Rate, Right Time, and Right Place for nutrient applications. A 4R strategy starts with soil testing and then looks at available nutrient sources & the farm’s specific ability to place nutrients at the right time for crop uptake. For more information on 4R Nutrient Stewardship, the mid-Atlantic 4R Nutrient Stewardship Association is an excellent place to start. (http://4rmidatlantic.com/). Here’s a checklist of questions our agronomists use to build a 4R fertility plan:
Rosetree Consulting is a proud PA4R Nutrient Stewardship Alliance
Rosetree Consulting Fertility Plan Checklist member.
- What is the realistic yield that can be achieved?
- What fields have higher/lower yield potential that can be managed separately?
- What is the planned rotation?
- Am I fertilizing for one crop or more?
- What manure is available?
- What is the cost of manure vs. the cost of fertilizer?
- Are my regulatory plans (nutrient management, manure management, etc.) up to date?
- Do I know the current analysis of the manure sources available to me?
- Is my spreader calibrated?
- What cover crops are being planted, and what’s the planned termination stage?
- What’s the expected contribution to fertility from my cover crop?
- What are my immediate needs for addressing soil test deficiencies?
- What are my longer-term needs for addressing soil test & plant test deficiencies & imbalances?
- What’s my fertilizer budget, and how will that be divided between lime, nitrogen, P&K, and starter?
- How long is my lease on this farm?
- Are my planters set up correctly to uniformly & consistently place seeds at the target depth?
- Should I modify my planter to apply nutrients, biologicals, & pesticides?
- Do I need to change my at-planting fertilizer analysis or rates based on sampling?
- What forms of nitrogen should I use? What applications should have a stabilizer?
- Do I plan to split apply nitrogen?
- What other nutrients will be included with each split application?
- How are soil phosphorus and potassium levels trending on my farms?
- Do I need to change sulfur management?
- How often will I drive across this acre to apply manure & fertilizer?
- What is the planned herbicide & fungicide program & what fertility options exist in those applications?
- Have I looked at my yield data? Is it scrubbed of errors and outliers?
- How do I want to use my yield data?
- Do I want to variable rate any inputs?
- Will nutrient applications be based on soil test results or crop removal scripts?
- What new things do I want to try this year??
- What test strips do I need set up & how will they be tracked?
Soil testing is not just a simple practice; it’s a powerful tool that empowers growers and land managers to make informed decisions for their agricultural endeavors. At Rosetree Consulting, we’re dedicated to providing you with accurate and insightful soil testing services in Pennsylvania and New Jersey. Our team will unlock the full potential of your land while promoting sustainable and environmentally responsible practices. With the knowledge gained from our comprehensive soil analyses, you can cultivate healthier crops, conserve resources, and contribute to a greener and more prosperous future. Contact us today to embark on a journey towards optimized soil management and improved agricultural outcomes.

